Simplified Delineation of a Market Area
Background
Given an existing supply location, a market area may be delineated empirically using customer spotting techniques, e.g., via surveys or loyalty card data. The simplest way to delineate a market area of a new supply location (or when no empirical data on customers are available) is to define a zone around a location based on a maximum distance or travel time. This maximum may be interpreted as a catchment threshold indicating an (artificial) limit beyond which demanders are no longer taken into account. The customer origins within the resulting area are regarded as a part of the market area. The total area may also be segmented geographically[1][2]. In a GIS (Geographic Information System) context, assigning the origins to the market area may be undergone with overlay analysis, more precisely: with a spatial join[3]. The methods of delineation differ in terms of how the (approximated) market area is calculated or which type of travel costs is used as a basis.
Buffers
As a first approximation, a market area may be delineated using a buffer. In the simplest case, a point (coordinates of the supply location) serves as the basis, around which a radius \(r\) is drawn, resulting in an area with a diameter of \(2r\). This is an example of three buffer zones (0-5, 5-10, and 10-15 kilometers) around Freiburg main station:
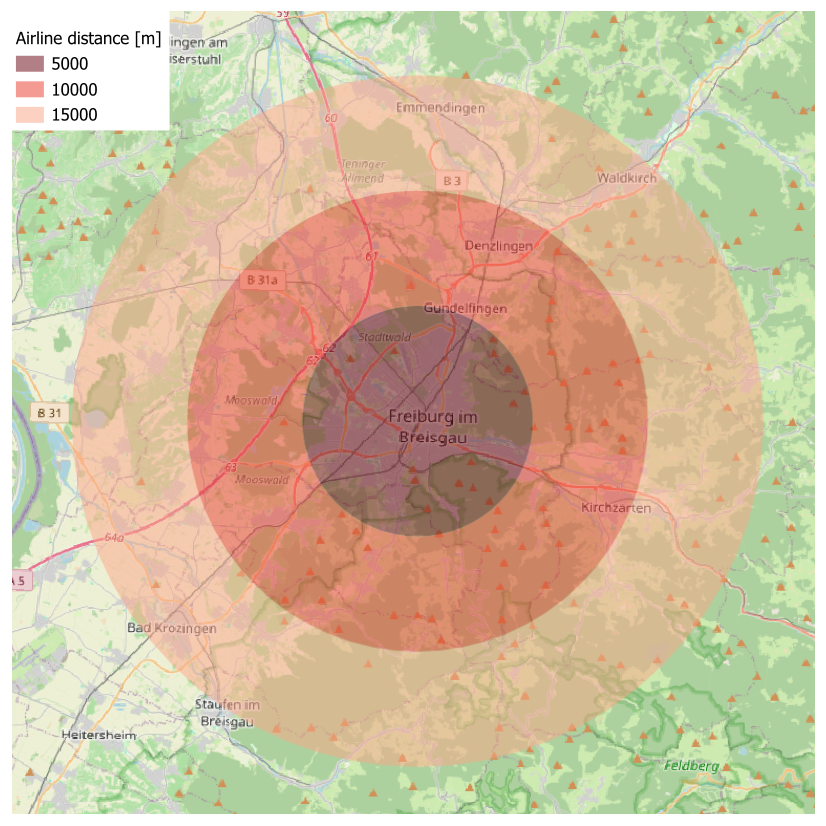
Source: own illustration (Base map: OpenStreetMap)
Buffer and overlay analyses are standard applications in a GIS context that have frequently been used in location planning in the past[3]. Apart from the input locations, they require no additional data. However, they do not take into account actual traffic conditions (road network, one-way streets, natural barriers such as mountains or rivers). In contrast, accessibility is expressed in terms of straight-line distance, which implies a homogeneous surface.
Road distances and travel times
While the aforementioned buffer analysis is based on straight-line distances, it is also possible to use road distances or travel times as a basis. Calculating road distances or travel times, whether by car or by another mode of (individual) transport, requires GIS-based network analysis using real road networks. Consequently, more data and significantly greater computing capacity are required than for buffer analysis. This is an example of three street distance zones (0-5, 5-10, and 10-15 kilometers) around Freiburg main station:
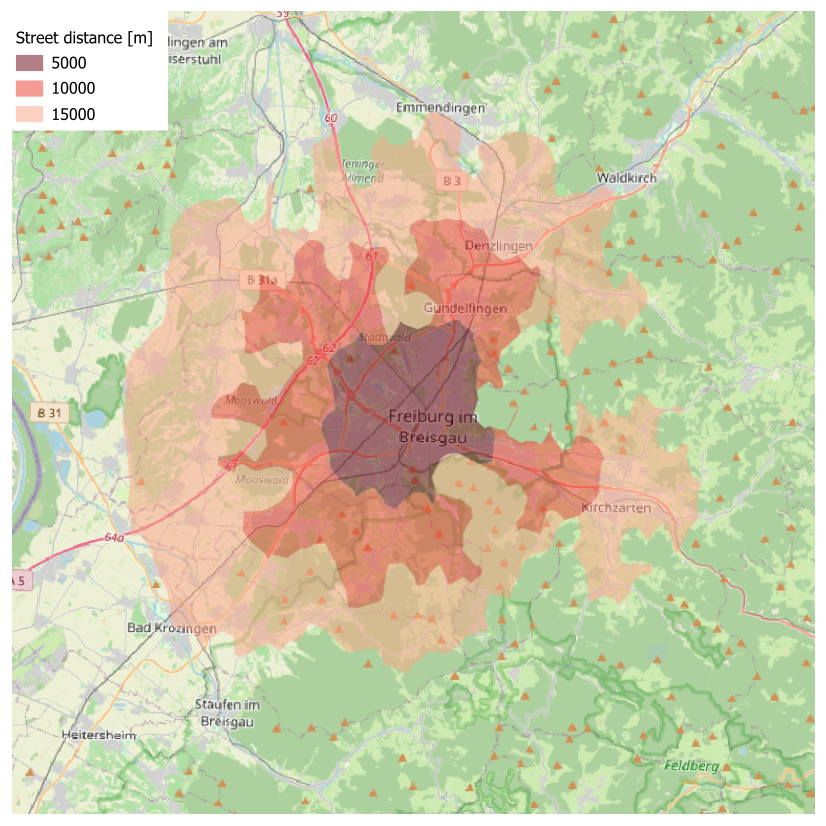
Source: own illustration (Base map: OpenStreetMap)
This is an example of three car travel time zones (0-5, 5-10, 10-15 minutes) around Freiburg main station:
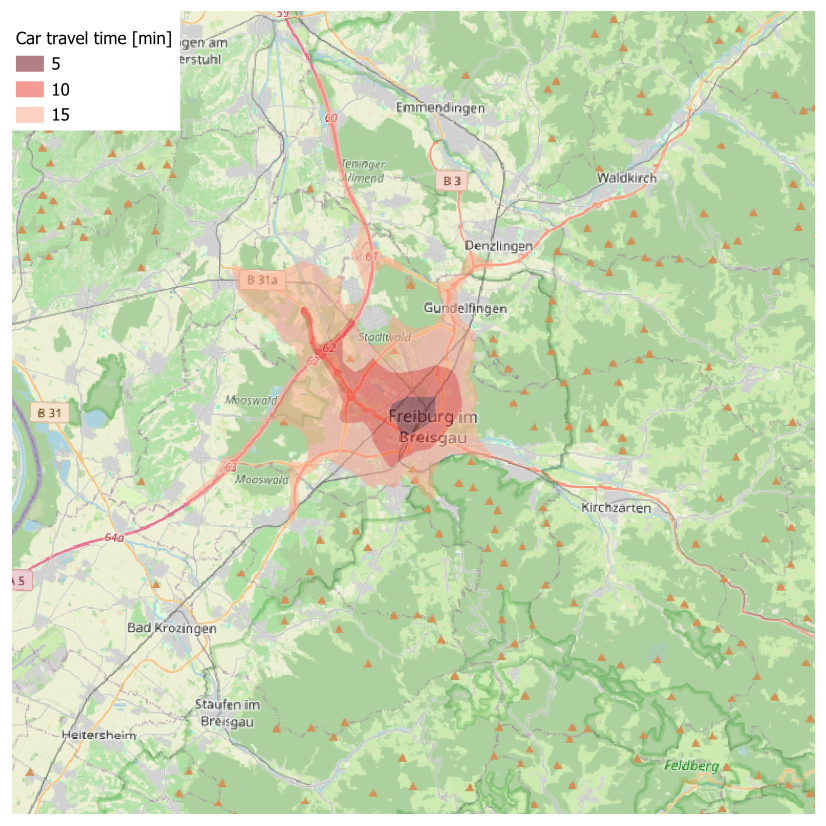
Source: own illustration (Base map: OpenStreetMap)
Street distance and travel times thus take into account realistic traffic conditions, however, this depends on the underlying network data. The network calculations presented here were conducted via OpenRouteService, with the road network being based on OpenStreetMap data.
Further notes
The same methodology may be applied in accessibility analysis. In these cases, the proximity analysis is mostly conducted from the customer origins level. Furthermore, the basic Two-Step Floating Catchment Area Analysis is based on a distance-specific delineation.
Results of customer spotting may be used for the parametrization of distance-decay functions[2].
Customer spotting data and pre-defined market areas (such as buffers, isochrones etc.) may be combined. For example, empirically recorded customer locations can be overlaid with predefined catchment area radii, distances, or travel times.
References
[1] Levy M, Weitz BA, Grewal D (2014) Retailing Management. New York: McGraw Hill.
[2] Wieland T (2017) Market Area Analysis for Retail and Service Locations with MCI. R Journal 9(1): 298-323. 10.32614/RJ-2017-020
[3] Benoit D, Clarke GP (1997) Assessing GIS for retail location planning. Journal of Retailing and Consumer Services 4(4): 239-258. 10.1016/S0969-6989(96)00047-1